 |
 |
 |
| Главная Журналы Популярное Audi - почему их так назвали? Как появилась марка Bmw? Откуда появился Lexus? Достижения и устремления Mercedes-Benz Первые модели Chevrolet Электромобиль Nissan Leaf |
Главная » Журналы » Transformer elementary form 1 ... 13 14 15 16 17 18 19 ... 38 characteristic сигле and, from a knowledge of the source impedance, find the proper value of capacitive reactance Xc at frequency jr- The value of fr should be such that the highest frequency to be covered lies on the flat part of the curve. Xq and fr determine the values of wind- 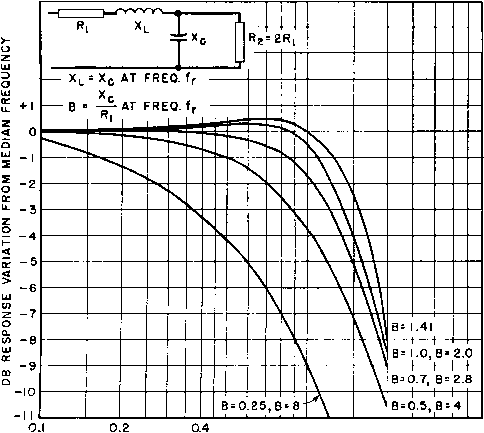 0.6 0.8 1.0 f/fr Fig. 110. Transformer characteristics at high frequencies (triode output). ing capacitance and leakage inductance that must not be exceeded in order to give the required performance. In Fig. 107(e) the capacitance is shown across the load. This is correct if the main body of capacitance is greater on the secondary than on the primary side. Normally this is true if the secondary winding has the greater number of turns. Figures 109, 110, and 111 are thus plotted specifically for step-up transformers. Modifications are necessary for step-down transformers, the equivalent circuit for which is shown in Fig. 113. Analysis shows the scalar voltage ratio to be 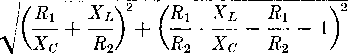 Notice the similarity to equation 63. In fact, if Ri = R2, equation 64 reduces to equation 63; for this case the response is the same for step-down and step-up transformers, and is given by Fig. 109. 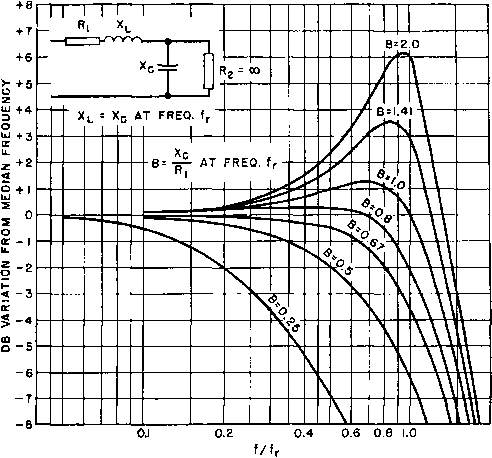 Fig. 111. Transformer characteristics at high frequencies (class A grid). For R2 ~ 2Ri, equation 64 becomes, after substitution in terms of frequency, E2 1 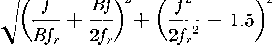 which is plotted in Fig. 113. Non-uniform response comes at somewhat lower frequency than in Fig. 110. The case of R2 = <xi for step-down transformers is not important. By inspection it can be seen to be the response of Ri and Xc in series, because Xl carries no current. This case rarely occurs in practice. 67. Harmonic Distortion. Audio response may be good according to Figs. 109, 110, 111, and 113, but at the same time the output may be badly distorted because of changes in load impedance or phase angle.   Fig. 112. Audio amplifier. Audio transformers are inverted on chassis at left. Power supply is at right. 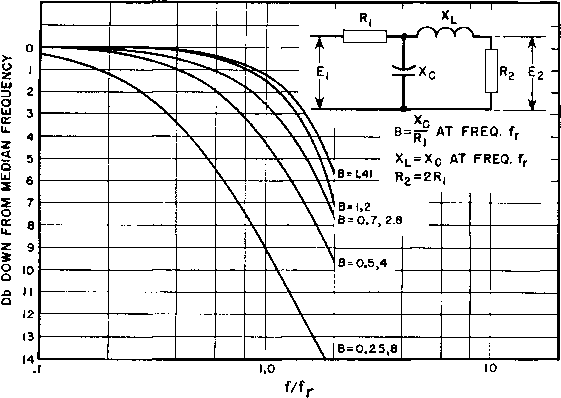 Fig. 113. High-frequency response of step-down transformers. This possibility is considered here for the case in which the load impedance is twice the source impedance. The phase angle of the equivalent circuits of Figs. 107(a) and (e) is found by taking the angle whose tangent is the ratio of imaginary to real components of the total circuit impedance in each case. This 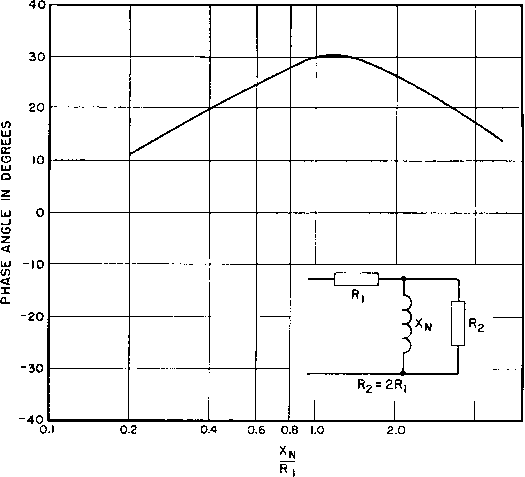 4.0 6.0 Fig. 114. Variation of amplifier phase angle at low frequencies. angle is plotted in Figs. 114 and 115 for the low- and high-frequency ranges, respectively, with the same abscissas as in Figs. 108 and 110. It is the angle between the voltage Ei and the current entering the equivalent circuits of Figs. 107(c) and (e) and therefore represents the angle between a-c grid voltage and plate current. Positive angle indicates lagging plate current. The phase angle exhibited by a transformer over the range considered in Figs. 114 and 115 does not exceed 30°, whereas for the most favorable curve in Fig. 115 {B = 1.0) it does not exceed 15°. To study the effect of phase angle alone upon distortion, the light load of 8,800 ohms is plotted upon the plate characteristics of triode type 851 in Fig. 116. The result is a sine wave of plate voltage. If the phase angle 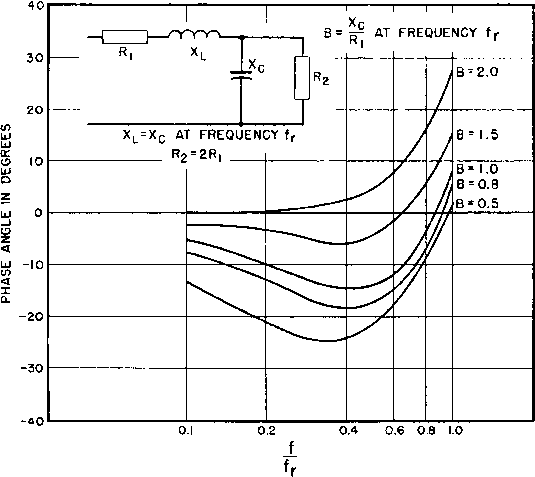 Fig. 115. Variation of amplifier phase angle at high frequencies. between grid voltage and plate current waves is then arbitrarily made 30°, as in Table XII, the elliptical load curve obtains. The wave of Table XII. 851 Triode Operation with 8,800-Ohm 30° Phase Angle Load
plate voltage is plotted for both zero and 30° phase angle in Fig. 117. These wave forms indicate that the phase angle encountered in audio гоо 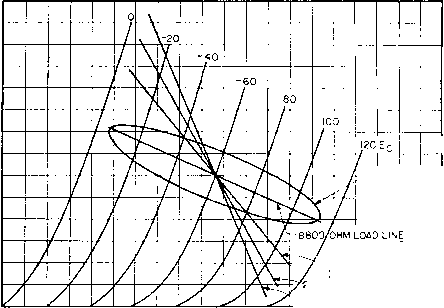 шло ELLIPSE -I WITH 30° PHUSE ANGLE BETWEEN GRID VOLTAGE S PLuTE CURRENT- 3100 OHM LOAD LINE RECOMMENDED) 200 OHM LOAD LINE 1550 OHM LOAD LINE 1000 2 000 PLATE VOLTAGE 3000 4000 Fig. 116. Triode type 851 with reactive load. 3 000 о > g 2000 to о z < 1000
90 180° 270° GRID VOLTAGE PHASE ANGLE Fig. 117. Plate voltage wave forms with zero and 30° phase angles. transformers does not of itself introduce much distortion in a lightly loaded triode. The influence of load impedance on distortion will be considered next. In Fig. 107(c) the load impedance, to the right of the dotted line, is Hence + jN R2 R2 Хдг (66) Equation 66 is plotted in Fig. 118. It shows the change in load Z from its median-frequency value R2, as the frequency is lowered. Abscissas are Xn/R2 instead of Xf/Ri as in Fig. 108. 1.0 0.9 0.8 0.7 0.6 0.5 0.4 0.3
0.4 0.6 0.8 1.0 Fig. 118. Variation of load impedance with transformer characteristics at low frequencies. For the higher audio frequencies, the load impedance at the right of the dotted line in Fig. 107(e) is AMPLIFIER TRANSFORMERS jXbR2 + XlXc - jXcR2 R2 - jXc Xc\ /XlXq Xl, R2 Xc (67) If we let Xc/R2 = D sl.t frequency/г, then, at any frequency/, Xc/R2 = Dfr/f. If this substitution is made in equation 67 and also if Xl/Xc = f/fr\ 2f 2 (67a) Bfr f Equation 67a is plotted in Fig. 119 for several values of D. The impedance varies widely from its median-frequency value, especially at lower values of D. 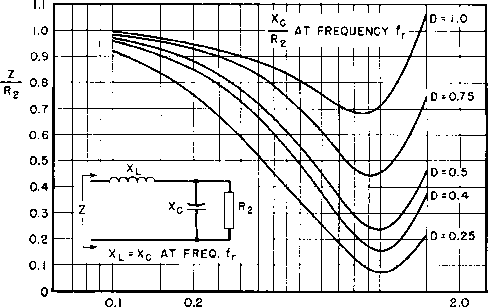 OA 0.6 0.8 1.0 f/fr Fig. 119. Variation of load impedance with transformer characteristics at high frequencies. From Figs. 118 and 119 it is possible to compare the change in impedance with the frequency response curves in Figs. 108 and 110. When this comparison is made it should be remembered that В = 2D for the triode conditions assumed here. If the amplifier response is allowed to fall off 1.0 db at the lowest frequency, the corresponding value of Xjr/Ei from Fig. 108 is 1.3. This means that X/R is 0.65. The corresponding load impedance in Fig. 118 is only 0.55 of its median-frequency value. Likewise, for 0.5-db droop of the frequency characteristic, the load impedance falls to 0.72, whereas for a good load impedance of 0.92 the frequency characteristic can fall off only 0.1 db. It is thus evident that load impedance may vary widely even with comparatively flat frequency characteristics. At high audio frequencies the divergences are still greater. Suppose, for example, that a transformer has been designed so that Xg/Ri is 1.0 at fr (that is, В = 1.0 in Fig. 110). Suppose further that the highest audio frequency at which the transformer operates is 0.75/. The amplifier then has a relatively flat characteristic, with a slight rise near its upper limit of frequency. In Fig. 119, the curve corresponding to В = 1.0 is marked D = 0.5, for which at 0.75/r the load impedance has dropped to 32 per cent of R2, an extremely poor match for the tube. It might be thought that, since 0.75/r is the upper frequency limit, the harmonics resulting from the low value of load impedance would not be amplified, and no harm would be done. But at the frequency 0.375/r, whose second harmonic would be amplified, the load impedance is only 0.69Й2. Between 0.375/,- and 0.75/r (over half of the amplifier frequency range) the load impedance gradually drops from 0.69Й2 to 0.32Й2-Thus distortion is large over a wide frequency range. It would be much better to design the transformer so that В = 2.0; the change in impedance is much less, and the rise in response is slight. To ascertain how much distortion these low load impedances produce, a series of loads was plotted in Fig. 116 on 851 plate characteristics: 100, 70, and 50 per cent of the class A UPO value of twice the plate resistance (3,100, 2,200, and 1,550 ohms, respectively). The distortion is tabulated below for 54 volts grid swing. Percentage Percentage Plate Voltage of 2nd of 3rd Swing (Peak Load Harmonic Harmonic to Peak) 3100 ohms 4 1 1500 2200 ohms 10 4 1270 1550 ohms 19 6 1100 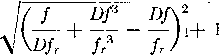 Equation 68 is plotted in Fig. 120. Impedance rises to peaks in the vicinity of fr, in contrast to the valleys in Fig. 119. For the same variation of impedance, the frequency range is greater for step-down transformers, especially with values of D = 0.5 and 0.7. Besides the harmonic distortion caused by variations in load impedance, at low frequencies additional distortion is caused by nonlinear magnetizing current. If a transformer is connected to a 60-cycle supply line, the no-load current contains large harmonics, but the voltage wave form remains sinusoidal because the line impedance is low. But if distorted magnetizing current is drawn from an amplifier tube, the plate resistance is high enough to produce a distorted voltage wave form across the transformer primary winding, caused mainly by the third harmonic. If the harmonic current amplitude Ih in the magnetizing current is found by connecting the transformer across a low-impedance source, the amplitude of harmonic voltage appearing in the output with a higher-impedance source is The plate voltage amplitude decrease with low impedance loads means that the combination of tube and transformer has a characteristic which droops instead of remaining fiat as indicated by the curve В = 1.0 in Fig. 110. This droop modifies the upper ends of the curves of Fig. 110. Although these curves were intended specifically for vacuum tubes, they were derived on the basis of a constant sinusoidal voltage in the source. Figure 119 demonstrates one important fact: For vacuum tubes operating into loads of twice the tube plate resistance, it is better to design transformers so that В - 2 or more. Then the output voltage and distortion are less affected by impedance \ariations at high frequencies. The actual frequency characteristics for triodes lie somewhere between the curves of Fig. 110 and the corresponding сиглев of Fig. 119. Designing transformers for В 2.0 means keeping the effective capacitance lower, but the leakage inductance may be proportionately greater than for transformers having В = 1.0. Variations of load impedance at high frequency shown in Fig. 119 are for step-up transformers. Similar variations for step-down transformers may be found from equation 68. 1 + 3, 1 ... 13 14 15 16 17 18 19 ... 38 |
|||||||||||||||||||||||||||||||||||||||||||||||||||||||||||||||||||||||||||||||||||||||||||||||||||||||||||||||||||||||||||||||||||||||||||||||||||||||||||||||||||||||||||||||||||||||||||||||||||||||||||||||||||||||||||||||||||||||||||||||||||||||||||||||||||||||||||||||||||||||||||||||||||||||||||||||||||||||||||||||||||||||||||||||||||||||||||||||||||||||||||||||||||||||||||||||||||||||||||||
|
© 2026 AutoElektrix.ru
Частичное копирование материалов разрешено при условии активной ссылки |