 |
 |
 |
| Главная Журналы Популярное Audi - почему их так назвали? Как появилась марка Bmw? Откуда появился Lexus? Достижения и устремления Mercedes-Benz Первые модели Chevrolet Электромобиль Nissan Leaf |
Главная » Журналы » Transformer elementary form 1 ... 16 17 18 19 20 21 22 ... 38 were the cathode grounded. This circuit is used when the output impedance Zl is variable or of low power factor so that normally it would be difficult to produce in it full output from the tube. The circuit has a low internal effective impedance as far as the output is concerned. It is approximately equal to the normal plate resistance Гр divided by the amplification factor of the tube. This is equivalent to saying that the effective internal impedance is approximately the reciprocal of the mutual conductance Qm, for class A or В amplifiers. Cathode followers have been used to drive grids of class В modulator tubes, which are highly variable loads. The circuit produces nearly constant output voltage but at the expense of increased grid swing. If the tube feeds a low impedance load, output may be increased by coupling the load through a transformer. Frequency response in cathode output transformers is usually fiat over a very wide range because of the low effective source impedance. 75. Wave Filter Principles. In preceding sections dealing with transformer frequency response, means for extending frequency range have been considered. In broadcast transmitters this is a vital problem. But in other applications amplifiers are used over a limited frequency range. It is sometimes desirable to allow certain frequencies which are present to pass through the amplifier at full amplitude but to suppress as nearly as possible certain other frequencies. The means usually employed to accomplish this result is a wave filter. In any such filter, the band of frequencies \vhich it is desired to transmit is known as the transmission band, and that which it is desired to suppress is known as the attenuation band. At some frequency, known as the cut-off frequency, the filter starts to attenuate. Transition between attenuation and transmission bands may be gradual or sharp; the filter is said to have gradual or sharp cut-off accordingly. When a filter is used in conjunction with a transformer-coupled amplifier, the frequency response of both filter and amplifier must be coordinated. In a later section it will be shown how transformer response may be improved through the use of wave filter principles. To avoid introducing losses and attenuation in the transmission bands, reactances as nearly pure as practicable are used in the elements of a wave filter. For example, in the low-pass filter T-section of Fig. 135, the inductance arms shown as L/2 and the capacitance С are made with losses as low as possible. Capacitors ordinarily used in filters have low losses, but it is a problem to make inductors which 1 See Feedback, by E. K. Sandeman, Wireless Engr., 17, 350 (August, 1940). have low losses. Values of inductor Q ranging from 10 to 200 are common, depending upon the value of inductance and the frequency of transmission. Therefore in wave filters the loss is mostly in the 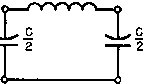 T SECTION TY SECTION Fig. 135, Low-pass filter sections. inductors. It can be shown that for pure reactance arms the values of reactance are such that in the transmission band 0 > > -1 (83) where Zi is the reactance of the series arm and Z2 is the reactance of the shunt arm. In the T-section of Fig. 135, Zj is 27г/[ (L/2) -f- (L/2) ] 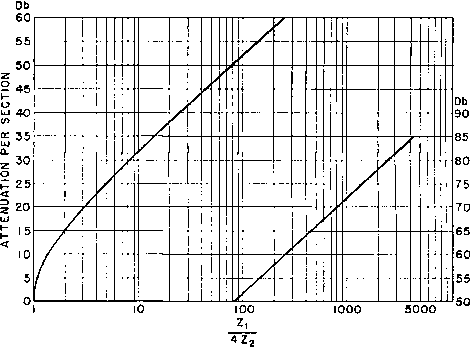 Fig. 136. Attenuation per section with pure reactance arms. = 27r/L and Z2 is the reactance of C. The attenuation for sections of filter like Fig. 135 is shown in Fig. 136, for a pure reactance network 1 See Transmission Networks and Wave Filters, by T. E. Shea, D. Van Nostrand Co., New York, 1929, p. 187. starting at the cut-off frequency. The attenuation is shown in decibels, and the abscissas are one-fourth of the ratio of series to shunt reactance in a full section. It is important, in the transmission band, to terminate the sections of filter in the proper impedance. Like a transmission line, a wave filter will deliver its full energy only into an impedance which is equal to its characteristic impedance. Many wave filters are composed of several sections which simulate transmission lines. A properly constructed filter exhibits the same impedance at either end when terminated at the opposite end with an impedance equal to its characteristic impedance. The impedance seen at any one point in the filter is called its image impedance; it will be the same in either direction provided that the source and terminating impedances are equal. In general, however, the image impedance will not be the same for all points in the filter. For example, the impedance looking into the left or T-section of Fig. 135 (if it is assumed to be terminated properly) will not be the same as that seen across the capacitor C. For that reason, another half-series arm is added between С and the termination to keep equal input and output impedances. The terminating sections at both the sending and receiving ends of a filter network are half-sections, whereas the intermediate sections are full sections. A full T-section of the type shown in Fig. 135 includes an inductance L equal to L/2 -[- L/2. The image impedance seen at the input terminals of the T-section of Fig. 135 is known as the mid-series impedance, and that seen across capacitor С is known as the mid-shunt impedance. Likewise, in the pi-section shown at the right in Fig. 135, the mid-shunt image impedance is seen at the input or output terminals. The mid-series impedance is seen at a point in the middle of coil L. This section terminates properly in its characteristic impedance at either end. Note that adjacent sections have С/2 for the shunt arm, so that a full section would again be composed of a capacitor С and an inductance L. The choice of T- or pi-sections is determined by convenience in termination, or by the kind of image impedance л^аг1а11оп with frequency that is desired. If these precautions are not observed, wave reflections are likely to cause a loss of power transfer in the transmission band. 76. Limitations of Wave Filters. Several factors modify the performance of wave filters, showm in Fig. 136, especially in the cut-off region. One is the reflection due to mismatch of the characteristic impedance. The load resistor is usually of constant value, whereas the image impedance changes to zero or infinity at cut-off for lossless filters. The resulting reflections cause rounding of the attenuation curve in the cut-off region instead of the sharp cut-off of Fig. 136. Another cause of gradual slope at cut-off is the Q of the filter chokes, or ratio of reactance to resistance. Figure 137 gives the attenuation 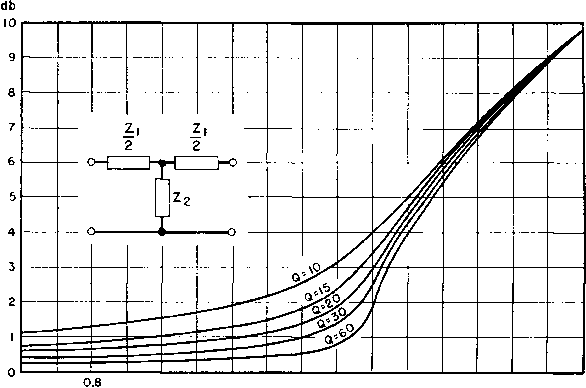 0,9 1.0 f/fc=FOR LOW PASS FILTER fc/f=F0R HIGH PASS FILTER Fig. 137. Insertion loss near cut-off of a constant-X filter section. at cut-off in terms of Q for a section of the so-called constant-- filter {e.g., Fig. 135). Still another cause of the gradual slope of cut-off is the practice of inserting a resistor to simulate the source impedance in attenuation tests. In typical cases the source and terminating resistances are equal. The correct prediction of filter response near cut-off requires a good deal of care. It cannot be taken directly from the usual attenuation charts. Phase shift is nearly linear with frequency up to approximately 50 1 See An Analysis of Constaut-X Low- and High-Pass Filters, by 0. S. Meixeli, RCA Rev., 5, 337 (January, 1941); also Single-Section m-Derived Filters, by C. W. Miller, Wireless Engr., Ш, 4 (January, 1944). per cent of cut-off frequency for constant-- filters in the transmission band. This fact is important in connection with networks used for the transmission of steep wave fronts, as in video amplifiers. It is proved in books on network theory that, when a non-sinusoidal voltage wave is applied to the input of a network, it appears at the output without distortion of its original shape if the phase shift of the network is proportional to frequency and if the amplitude response is flat for all frequencies. In no actual network are these conditions fulfilled completely, but the closer a network approximates them the smaller the distortion it causes in irregular wave forms. Linearity of phase shift is usually more essential to good wave form than flatness of response. For this reason, when a non-sinusoidal wave passes through a filter, distortion is minimized if the major frequency components of the wave all lie in the linear region of the phase shift curve. Considerable judgment must be exercised in the choice of cut-off frequencies. Higher-order harmonics are usually of smaller amplitude, and the natural tendency is to include too few of them in the pass band; then the output wave form is a poor reproduction of the input. In band-pass filters, the effects just noticed are present, with the additional complication of band width. The filter designer must choose a band width of transmission such that high attenuation is afforded at unwanted frequencies and low attenuation at desired frequencies. This is often not a simple choice. For a given frequency separation from the mid-frequency, attenuation decreases as the filter band width is made wider. Impedance variation is much less with a wider band width. Therefore, choosing a narrow band width attenuates frequencies in the transmission band because of reflections. 77. Artificial Lines. Sometimes a certain amount of time delay must be interposed between one circuit and another. Or, if the length of a transmission line is not an exact multiple of 90°, some means must be found to increase its length to the next higher multiple of 90°. For either of these purposes, artificial lines are used. They may operate at a single frequency or over a range of frequencies. They may be tapped for adjustment to suit any frequency in a given range, so that impedance and line length are correct. The configuration may be either T or тг, high- or low-pass. Figure 138 shows these four combinations for any electrical length в of line section in degrees. It 1 See Communication Networks, by E. A. Guillemin, John Wiley & Sons, New York, 1935 Vol. IL p. 474. is assumed in this figure that the line operates at a single frequency and is terminated in a pure resistance equal in value to the line characteristic impedance Zq. Figure 139 is the vector diagram for a leading XXc XXc XlZo SINe TAN G 2 PHASE SHIFT LAGGING XlZqTAN I SIN e LAGGING Zq TAN G. 2 XcZoSINe LEADING Zo*CHARACTERISTIC IMPEDANCE OF LINE e - ELECTRICAL LENGTH OF LINE Fig. 138. Artificial line relations. <HI- Xl = Zq sme XcZoTAN ! LEADING phase shift pi-section line of 90° electrical length. Proportions of L and С are somewhat different in these line sections than in wave filters. 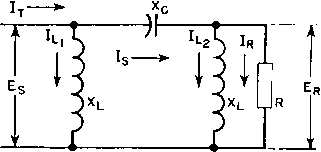 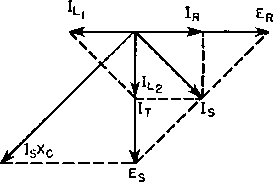 Fig. 139. Vector diagram for 90-degree line length. To obtain approximately constant time delay over a range of frequencies, several constant-iC low-pass filter sections may be used, each having a cut-off frequency high enough so that the phase shift is pro- 10,000 fr£q. (n cycles for .014 thickness - -I-1-m- multiply core loss * at 60 cy and 10,000 gauss by core .loss factor * for silicon steel, 0.6 w/l8 for ni-fe alloy 025 w./lb. -for grain oriemted steel ojsw.ab, 1,000 .001 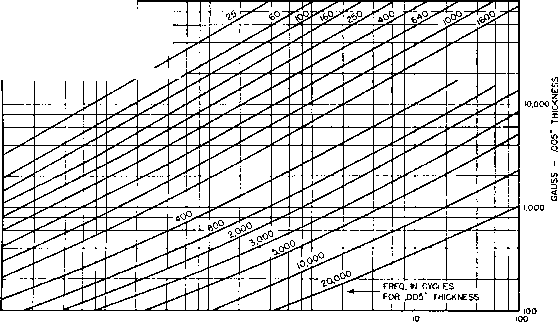 approximate core loss factor Fig. 140. Core loss in laminations 0.014 and 0.005 in. thick. 78. Filter Inductor Design. In Sections 75 and 76, it was pointed out that inductors for wave filters must have Q great enough to provide low attenuation in the pass band. In design, attention must be given as much to Q as to inductance. Low-loss core material is essential for high Q. Nickel-iron alloys are widely used; the lamination thickness depends on frequency. At frequencies up to 400 cycles, 0.014-in.-thick laminations are used, and at frequencies higher than 400 cycles, 0.005 in. thick. This is an approximate practical guide. Figure 140 shows how loss varies with thickness, frequency, and flux density. At frequencies higher than 1,000 cycles, flux density must be quite small for low core loss. In the majority of audio applications, low flux density conditions prevail. Under such conditions, core loss is largely eddy-current loss and may be treated as a linear resistance. portional to frequency. The time delay per section is then /27г/ at any frequency in the range, and в = 27rf\/LC, where в is the phase shift in radians, L is the inductance per section, and С is the capacitance per section. In Fig. 139, Ец = Eg. If the section were terminated in impedance higher than Zq, Er > Es. The line section is then a kind of transformer, although the ratio Er/Es varies with frequency. Ninety-degree line sections are often used at high frequencies to obtain transformation of voltage. Core gaps are used in filter reactors to obtain better Q. For any core, inductance per turn, and frequency, there is a maximum value of Q. The reason for this is that the a-c resistance is composed of at least two elements: the winding resistance and the equivalent core loss. In previous chapters the core loss has been regarded as an equivalent resistance across a winding. But it can also be regarded as an equivalent resistance in series with the winding. Figure 141 shows this equivalence, which may be stated: Fig. 141. Shunt and series equivalent core-loss resistance. For values of Q > 5, JR.bX ish + jX (84) where Rsh = equivalent shunt resistance Rser = equivalent series resistance X = winding reactance = 2тг/Ь. The equivalence depends upon frequency. The formula for large Q may then be changed to RR (85) X 2irfL or Q is proportional to shunt resistance, the winding resistance being neglected. Thus Q can be increased by lowering L, and L is lowered by increasing core gap, but there are limits on the increase of Q that can be obtained in this way. First, the winding resistance is not negligible. With small gaps, maximum Q is obtained when winding resistance and equivalent series core-loss resistance are equal. For a given air gap there is a certain frequency fm at which this maximum Q holds. At higher and lower frequencies, the manner in which Q falls below the maximum is found as follows: Let Rc be the coil winding resistance. Then Rc + Rs If for iser we substitute the value obtained from equation 84, we have, approximately, X 1 Q =-- = -77 (86) Rox X Rsh Equation 86 therefore gives the relation of Q to frequency. When it is plotted on log-log coordinates with frequency as the independent variable, it is symmetrical about the frequency /, for which Q is a 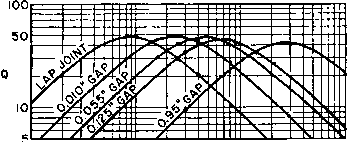 50 100 500 1000 5000 lOOOO FREQUENCY IN CYCLES PER SECOND Fig. 142. Frequency variation of Q for an iron-core coil with air gaps. maximum. If the core gap is changed, frequency fm changes. Figure 142 shows how the Q of a small inductor varies with frequency for several values of air gap in the core. All these curves have the same shape, a fact which suggests the use of a template for interpolating such curves. Another phenomenon that limits Q is the flux fringing at the core gap, the influence of which on inductance was discussed in Chapter 3. As the air gap increases, the flux across it fringes FLUX UPPER HALF OF CORE GAP- OF CORE more and more, like that shown in Fig. 143. Magnetic flux fringe at core gap. Fig. 143, and L ceases to be inversely proportional to the gap. Some of the fringing flux strikes the core perpendicular to the laminations and sets up eddy currents which cause additional loss. Accurate prediction of gap loss depends on the amount of fringing flux. For laminated cores it can be estimated from iSee How Good Is an Iron-Cored Coil? by P. K. McElroy and R. F. Field, General Radio Experimenter, XVI (March, 1942). This article also discusses choke design from the standpoint of similitude. Wg = GlgdfxteBj watts (87) where G = & constant (17 X lO* for siHcon steel) d = lamination tongue width in inches }x = permeability te = lamination tks. in inches / = frequency in cycles Вт = peak core induction in gauss Ig = gap length in inches. In Section 33, Chapter 3, it was shown that under certain conditions maximum transformer rating for a given size is obtained when core and winding losses are equal. The same would be true for inductors with zero core gap. Similarly it may be shown that, if the core gap is large enough to cause appreciable gap loss, maximum Q is obtained with core, winding, and gap losses equal. In a given design, if this triple equality does not result in the required Q, size must be increased. Losses may be compared by finding either the equivalent series resistances or the equivalent shunt resistances. 79. Powdered Iron Cores. As frequency increases above a few thousand cycles, gap loss becomes predominantly large. At such frequencies, cores of powdered iron are preferable for large Q. Powdered-iron cores are made from several grades of iron and nickel-iron alloys. Proportions of insulating bond and iron powder are varied to obtain permeabilities ranging from 10 to 125. Permeability in such cores is only apparent; it is far less than the inherent permeability of the iron used because of the many small gaps throughout the core structure. Finely divided iron has low eddy-current loss and virtually zero gap loss. Equation 85 indicates how Q varies with frequency; that is, low-permeability cores should be used to reduce inductance and maintain large Q at high frequencies. At frequencies higher than audio, coil eddy-current losses make stranded wire necessary. This is discussed further in Chapter 7. One of the problems of filter design is the maintenance of cut-off and attenuation frequencies under conditions of varying temperature. This may be so important as to dictate the choice of core material. Powdered cores are available which have very low temperature coefficients. Usually these cores have less than the maximum Q for a given kind of iron powder. With low-temperature-coefficient cores, attention also must be paid to filter capacitors in order to obtain the requisite overall fre uency stability. 1 ... 16 17 18 19 20 21 22 ... 38 |
|
© 2026 AutoElektrix.ru
Частичное копирование материалов разрешено при условии активной ссылки |