 |
 |
 |
| Главная Журналы Популярное Audi - почему их так назвали? Как появилась марка Bmw? Откуда появился Lexus? Достижения и устремления Mercedes-Benz Первые модели Chevrolet Электромобиль Nissan Leaf |
Главная » Журналы » Simple coaxial reflectometer 1 ... 10 11 12 13 14 15 16 ... 80 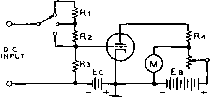 ZERO-ADJUST Figure 31 D-C VACUUM TUBE VOLTMETER range switch (figure 31) may precede the v.t. v.m. The voltage to be measured is applied to voltage divider, Rl, R2, R3, by means of the voltage range switch. Resistor R4 is used to protect the meter from excessive input voltage to the v.t.v.m. in the plate circuit of the tube an additional battery and a variable resistor ( zero adjustment ) are used to balance out the meter reading of the normal plate current of the tube. The zero adjustment potentiometer can be so adjusted that the meter M reads zero current with no input voltage to the v.t.v.m. When a d-c input voltage is applied to the circuit, current flows through the meter, and the meter reading is proportional to the applied d-c voltage. The Bridge-type V.T.V.M. Another important use of a d-c amplifier is to show the exact point of balance between two d-c voltages. This is done by means of a bridge circuit with two d-c amplifiers serving as two legs of the bridge (figure 32). With no input signal, and with matched triodes, no current will be read on meter M, since the IR drops across Ri and R2 are identical. When a signal is applied to one tube, the IR drops in the plate circuits become unbalanced, and meter M indicates the unbalance. In the same way, two d-c voltages may be compared if they are applied to the two input circuits. When the voltages are equal, the bridge is balanced and no current flows through the merer. If one voltage changes, the bridge becomes unbalanced and indication of this will be noted by a reading of the meter. A Modern VTVM For the purpose of analysis, the operation of a modern v.t.v.m. will be described. The Heathkit V-7A is a fit instrument for such a description, since it is able to measure positive or negative d-c potentials, a-c r-m-s values, peak-to-peak values, and resistance. The circuit of this unit is shown in figure 33. A sensitive 200 d-c D.c INPUT* О D.c INPUT Figure 32 BRIDGE-TYPE VACUUM TUBE VOLTMETER microammeter is placed in the cathode circuit of a 12AU7 twin triode. The zero adjust control sets up a balance between the two sections of the triode such that with zero input voltage applied to the first grid, the voltage drop across each portion of the zero adjust control is the same. Under this condition of balance the meter will read zero. When a voltage is applied to the first grid, the balance in the cathode circuits is upset and the meter indicates the degree of unbalance. The relationship between the applied voltage on the first grid and the meter current is linear and therefore the meter can be calibrated with a linear scale. Since the tube is limited in the amount of current it can draw, the meter movement is electronically protected. The maximum test voltage applied to the 12AU7 tube is about 3 volts. Higher applied voltages are reduced by a voltage divider which has a total resistance of about 10 megohms. An additional resistance of 1-megohm is located in the d-c test prod, thereby per-miuing measurements to be made in high impedance circuits with minimum disturbance. The rectifier portion of the v.t.v.m. is shown in figure 34. When a-c measurements are desired, a 6AL5 double diode is used as a full wave rectifier to provide a d-c voltage proportional to the applied a-c voltage. This d-c voltage is applied through the voltage divider string to the 12AU7 tube causing the meter to indicate in the manner previously described. The a-c voltage scales of the meter are calibrated in both RMS and peak-to-peak values. In the 1.5, 5, 15, 50, and 150 volt positions of the tange switch, the full a-c voltage being measured is applied to the input of the 6AL5 full wave rectifier. On the 500 and I5OO volt positions of the range switch, a divider network reduces the applied voltage in otdei to limit the voltage input to the 6AL5 to a safe recommended level. Лкнйе Switch МО.I DECK fRONT 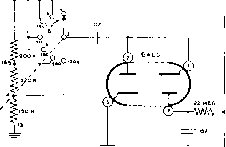 22 MEC ггыЕО ггм£о -wv\-wwv- 22 meg З.Э MEG  RANGE mo. 2 DECK 10 К \\OK OOS > 10 MEG NOTES ALL SXnCMES VIEWEP fROM ЯЕАВ RANGE SWITCH MAX.CC- SELECTOR AC POS. ALL RESISTORS IN OHMS К=ЮОО MEG = 1,000,000 ALL CAPACITORS MFD Ф SCREWDRIVER ADJUST ALL VOLTAGES MEASURED WITH VTVM OR гО.ООй ONMSVOLT 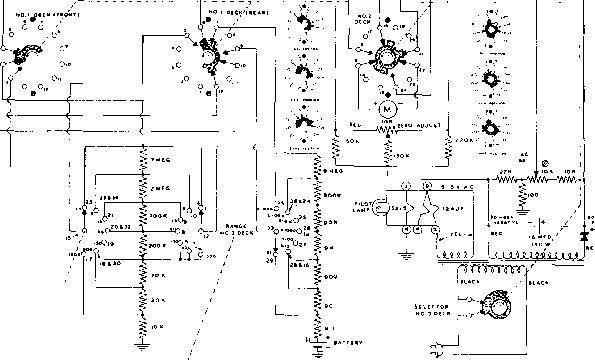 5 > > 6 > t- \ Ш S о X I- HANDBOOK Vacuum Tube Voltmeters .02 6AL5 shielded probe case A-C INPUT 150U, RMS MAX, 22 meg. to vtvm -iW-- dc input jack Figure 34 FULL-WAVE RECTIFIER FOR V.T.V.M. The a-c calibrate control (figure 33) is used to obtain the proper meter deflection for the applied a-c voltage. Vacuum tubes develop a contact potential between tube elements. Such contact potential developed in the diode would cause a slight voltage to be present at all times. This voltage is cancelled out by proper application of a bucking voltage. The amount of bucking voltage is controlled by the a-c balance control. This eliminates zero shift of the meter when switching from a-c to d-c readings. For resistance measurements, a 1,5 volt battery is connected through a string of multipliers and the external resistance to be measured, thus forming a voltage divider across the battery, and a resultant portion of the battery voltage is applied to the 12AU7 twin to vtv M Tt
Figure 35 R-F PROBE SUITABLE FOR USE IN IKC-100 MC RANGE triode. The meter scale is calibrated in resistance (ohms) foe this function. Test Probes Auxiliary test probes may be used with the v.t.v.m. to extend the operating range, or to measure radio frequencies with high accuracy. Shown in figure 35 is a radio frequency probe which provides linear response to over 100 megacycles, A crystal diode is used as a rectifier, and d-c isolation is provided by a .005 uufd capacitor. The components of the detector are mounted within a shield at the end of a length of coaxial line, which terminates in the d-c input jack of the v.t.v.m. The readings obtained are RMS, and should be multiplied by 1.414 to convert to peak readings. CHAPTER SEVEN High Fidelity Techniques The art and science of the reproduction of sound has steadily advanced, following the major audio developments of the last decade. Public acceptance of home music reproduction on a high fidelity basis probably dates from the summer of 1948 when the Columbia L-P microgroove recording techniques were introduced. The term high fidelity refers to the reproduction of sound in which the different distortions of the electronic system are held below limits which are audible to the majority of listeners. The actual determination, therefore, of the degree of fidelity of a music system is largely psychological as it is dependent upon the ear and temperament of the listener. By and large, a rough area of agreement exists as to what boundaries establish a hi-fi system. To enumerate these boundaries it is first necessary to examine sound itself. 7-1 The Nature of Sound Experiments with a simple tuning fork in the seventeenth century led to the discovery that sound consists of a series of condensations and rarefactions of the air brought about by movement of air molecules. The vibrations of the prongs of the fork are communicated to the surrounding air, which in turn transmits the agitation to the ear drums, with the result that we hear a sound. The vibrating fork produces a sound of extreme regularity, and this regularity is the essence of music, as opposed to noise which has no such regularity. As shown in figure 1, the sound wave of the fork has frequency, period, and pitch. The frequency is a measure of the number of vibrations per second of the sound. A fork tuned to produce 261 vibrations per second is tuned to the musical note of middle-C. It is of interest to note that any object vibrating, moving, or alternating 261 times per second will produce a sound having the pitch of middle-C. The pitch of a sound is that property which is determined by the frequency of vibration of the source, and not by the source itself. Thus an electric dynamo producing 261 c.p.s. will have a hum-pitch of middle-C, as will a siren, a gasoline engine, or other object having the same period of oscillation. ruNINc; FORK Figure 1 VIBRATION OF TUNING FORK PRODUCES A SERIES OF CONDENSATIONS AND RAREFACTIONS OF AIR MOLECULES. THE DISPLACEMENT OF AIR MOLECULES CHANGES CONTINUALLY WITH RESPECT TO TIME, CREATING A SINE WAVE OF MOTION OF THE DENSITY VARIATIONS. Nature of Sound 135
Figure 2 THE EQUAL-TEMPERED SCALE CONTAINS TWELVE INTERVALS, EACH OF WHICH IS 1.06 TIMES THE FREQUENCY OF THE NEXT LOWEST. THE HALFTONE INTERVALS INCLUDE THE ABOVE NOTES PLUS FIVE ADDITIONAL NOTES: 277.2, 311.1, 370, 415.3, 466.2 REPRESENTED BY THE BLACK KEYS OF THE PIANO. The Musical The musical scale is composed Scale of notes or sounds of various frequencies that bear a pleasing aural relationship to one another. Certain combinations of notes are harmonious to the ear if their frequencies can be expressed by the simple ratios of 1:2, 2:3, 3:4, and 4:5. Notes differing by a ratio of 1:2 are said to be separated by an octave. The frequency interval represented by an octave is divided into smaller intervals, forming the musical scales. Many types of scales have, been proposed and used, but the scale of the piano has dominated western music for the last hundred or so years- Adapted by J. S. Bach, the equal-tempered scale (figure 2) has twelve notes, each differing from the next by the ratio 1:1.06. The reference frequency, or American Standard Pitch is A, or 440-0 cycles. Harmonics and The complex sounds pro-Overtones duced by a violin or a wind instrument bear Httle resemblance to the simple sound wave of the tuning fork. A note of a clarinet, for example (when viewed on an oscilloscope) resembles figure 3. Vocal sounds are even more complex than this. In 1805 Joseph Fourier advanced his monumental theorem that made possible a mathematical analysis of all musical sounds by showing that even the most complex sounds are made up of fundamental vibrations plus harmonics, or overtones. The tonal qualities of any musical note may be expressed in terms of the amplitude and phase relationship between the overtones of the note. To produce Overtones, the sound source must be vibrating in a complex manner, such as is shown in figure 3. The resulting vibration is a combination of simple vibrations, producing a rich tone having fundamental, the octave tone, and the higher overtones. Any sound - 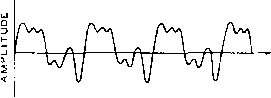 Figure 3 THE COMPLEX SOUND OF A MUSICAL INSTRUMENT IS A COMBINATION OF SIMPLE SINE-WAVE SOUNDS, CALLED HARMONICS. THE SOUND OF LOWEST FREQUENCY IS TERMED THE FUNDA-MENTAL. THE COMPLEX VIBRATION OF A CLARINET REED PRODUCES A SOUND SUCH AS SHOWN ABOVE. no matter how complex - can be analyzed into pure tones, and can be reproduced by a group of sources of pure tones. The number and degree of the various harmonics of a tone and their phase relationship determine the quality of the tone. For reproduction of the highest quality, these overtones must be faithfully reproduced. A musical note of 523 cycles may be rich in twentieth order overtones. To reproduce the original quality of the note, the audio system must be capable of passing overtone frequencies of the order of 11,000 cycles. Notes of higher fundamental frequency demand that the audio system be capable of good reproduction up to the maximum response limit of the human ear, in the region of 15,000 cycles. Reproduction Many factors enter into the Limitotions problem of high quality audio reproduction. Most important of these factors influence the overall design of the music system. These are: 1-Restricted frequency range. 2-Nonlinear distortions. 3-Transient distortion. 4-Nonlinear frequency response. 5-Phase distortion. 6-Noise, wow , and flutter . A restricted frequency range of reproduction will tend to make the music sound tinny and unrealistic. The fundamental frequency range covered by the various musical instruments and the human voice lies between 15 cycles and 9,000 cycles. Overtones of the instruments and the voice extend the upper audible limit of the music range to 15,000 cycles or so. In order to fully reproduce the musical tones falling within this range of frequencies the music system must be capable of flawlessly reproducing all frequencies within the range without discrimination.
Figure 4 Nonlinear qualities such as harmonic and tntermodulation (IM) distortion are extremely objectionable and are created when the output of the music system is not exactly proportional to the input signal. Nonlinearity of any part of the system produces spurious harmonic frequencies, which in turn lead to unwanted beats and resonances. The combination of harmonic frequencies and intermodulation products produce discordant tones which are disagreeable to the ears. The degree of intermodulation may be measured by applying two tones fi and fa of known amplitude to the input of the amplifier under test. The relative amplitude of the difference tone (fj-fi) is considered a measure of the intermodulation distortion. Values of the order of 4% IM or less define a high fidelity music amplifier. Response of the music system to rapid transient changes is extremely important. Transient peaks cause overloading and shock-excitation of resonant circuits, leaving a hang-over effect that masks the clarity of the sound. A system having poor transient response will not sound natural to the ear, even though the distortion factors are acceptably low. Linear frequency response and good power handling capability over the complete audio range go hand in hand. The response should be smooth, with no humps or dips in the curve over the entire frequency range. This requirement is particularly important in the electromechanical components of the music system, such as the phonograph pickup and the loudspeaker. Phase distortion is the change of phase angle between the fundamental and harmonic frequencies of a complex tone. The output wave envelope therefore is different from the envelope of the input wave. In general, phase distortion is difficult to hear in sounds having complex waveforms and may be considered to be sufficiently low in value if the IM figure of the amplifier is acceptable. Noise and distortions introduced into the program material by the music system must be kept to a minimum as they are particularly noticeable. Record scratch, turntable rumble , and flutter can mar an otherwise high quality system. Inexpensive phonograph motors do not run at constant speed, and the slight variations in speed impart a variation in pitch {wow) to the music which can easily be heard. Vibration of the motor may be detected by the pickup arm, superimposing a low frequency rumble on the music. The various distortions that appear in a music system are summarized in figure 4, together with suggested limits within which the system may truly be termed high fidelity. 7-2 The Phonograph The modern phonograph record is a thin disc made of vinylite or shellac material. Disc rotation speeds of 78.3, 33 1/3, and 45 r.p.ra. are in use, with the older 78.3 r.p.m; speed gradually being replaced by the lower speeds. A speed of 16 2/3 r.p.m. is used for special talking book recordings. A continuous groove is cut in the record by the stylus of the recording machine, spiralling inward towards the center of the record. Amplitude variations in this groove proportional to the sound being recorded constitute the means of placing the intelligence upon the surface of the record. The old 78.3 r.p.m. recordings were cut approximately 100 grooves per inch, while the newer micro-groove recordings are cut approximately 250 grooves per inch. Care must be taken to see that the amplitude excursions of one groove do not fall into the adjoining groove. The groove excursions may be controlled by the system of recording, and by equalization of the recording equipment. Recording The early commercial phono-Techniques graph records were cut with a mechanical-acoustic system that produced a constant velocity characteristic with the amplitude of cut increasing as the recorded frequency decreased (figure 5A). When the recording technique became advanced enough to reproduce low audio frequencies, it was necessary to reduce the amplitude of the lower frequencies to prevent overcutting the record. A crossover point near 500 cycles was chosen, HANDBOOK High Fidelity Amplifier 137 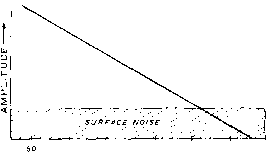 IOO 200 500 1000 2 FREQUENCY (cps] CONSTANT VELOCITY RECORDINC 5000 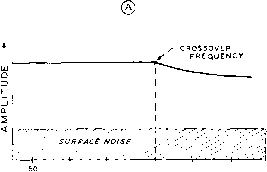 100 200 500 1000 FREQUENCY (cp-) 2000 5 000 CONSTANT AMPLITUDE BELOW CROSSOVER FREQUENCY, HICH FREQUENCY PRE-EMPHASIS ABOVE CROSSOVER FREQUENCY jcCROSSOVER / / FREQUENCY 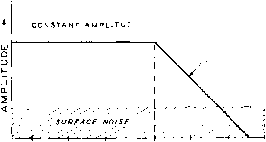 CONSTANT VELOCITY 50 100 200 SOO 1000 200 FREQUENCY (CPS) CONSTANT AMPLITUDE BELOW CROSSOVER FREQUENCY, CONSTANT VELOCITY ABOVE CROSSOVER FREQUENCY 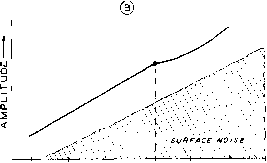 50 100 200 500 1000 2( FREQUENCY (cps) RESPONSE OF RECORD OF SC PLAYED ON PROPERLY COMPENSATED EQUIPMENT о 1-5 -5 О UJ -10 > UJ-20 -25 RlAA* EQUALIZER CURVE ©1 RIAA PLAYBACK CURVE Ч 70 100 300 500 1000 3000 10000 30000 FREQUENCY. CPS and a constant amplitude groove was cut below this frequency (figure 5B). This system does not reproduce the higher audio notes, since the recording level rapidly drops into the surface noise level of the record as the cutting frequency is raised. The modern record employs pre-emphasis of the higher frequencies to boost them out of the noise level of the record (figure 5C). When such a record is played back on properly compensated equipment, the audio level will remain well above the background noise level, as shown in figure 5D. Figure 5 MODERN PHONOGRAPH RECORD EMPLOYS CONSTANT AMPLITUDE CUT BELOW CROSSOVER POINT AND HIGH FREQUENCY PRE-EMPHASIS (BOOST) ABOVE CROSSOVER FREQUENCY. The Phonograph The most popular types Pickup of pickup cartridges in use today are the high impedance crystal unit, and the low impedance variable reluctance cartridge. The crystal pickup consists of a Rochelle salt element which is warped by the action of the phonograph needle, producing an electrical impulse whose frequency and amplitude are proportional to the modulation of the record groove. One of the new transducer crystal cartridges is shown in figure 6. When working into a high impedance load, the output of a high quality crystal pickup is of the  Figure 6 NEW CRYSTAL TRANSDUCER CARTRIDGE PROVIDES HIGH-FIDELITY OUTPUT AT RELATIVELY HIGH LEVEL order of one-half volt or so. Inexpensive crystal units used in 78 r.p.m. record changers and ac-dc phonographs may have as much as two or three volts peak output. The frequency response of a typical high quality crystal pickup is shovin in figure 7. The variable reluctance pickup is shown in figure 8. The reluctance of the air gap in a magnetic circuit is changed by the movement of the phonograph needle, creating a variable voltage in a small coil coupled to the magnetic lines of force of the circuit. The output impedance of the reluctance cartridge is of the order of a few hundred ohms, and the output is approximately 10 millivolts. For optimum performance, an equalized preamplifier stage is usually employed with the reluctance pickup. The circuit of a suitable unit is shown in figure 9. Equalization is provided by Rs, Rj, and Сз, with a low frequency crossover at about 500 cycles. Total equalization is 15 db. High frequency response may be limited by reducing the value of Ri to 5,000 - 15,000 ohms. The standard pickup stylus for 78 r.p.m. records has a tip radius of .0025 inch, whereas the microgroove (33 1/3 and 45 r.p.m.) stylus has a tip radius of .001 inch. Many pickups. 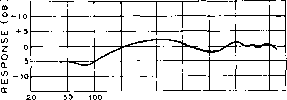 200 500 1000 2000 5000 FREQUENCY (cps) Figure 7 FREQUENCY RESPONSE OF HIGH-QUALITY CRYSTAL PHONOGRAPH CARTRIDGE. (ELECTROVOICE 56-DS POWER POINT TRANSDUCER)  Figure 8 RELUCTANCE CARTRIDGE IS STANDARD PICK-UP FOR MUSIC SYSTEM. Low stylus pressure of four grams insures minimum record wear. Dual stylus is used having two needle tip diameters for long playing and 78 R.P.M. recordings, therefore, are designed to have interchangeable cartridges or needles to accomodate the different groove widths. 7-3 The High Fidelity Amplifier A block diagram of a typical high fidelity system is shown in figure 10. A preamplifier is used to boost the output level of the phonograph pickup, and to permit adjustment of input selection, volume, record compensation, and tone control. The preamplifier may be mounted directly at the phonograph turntable position, permitting the larger power amplifier to be placed in an out of the way position. The power amplifier is designed to operate from an input signal of a volt or so derived from the preamplifier, and to build this signal to the desired power level with a minimum amount of distortion. Maximum power output levels of ten to twenty watts are common for home music systems. The power supply provides the smoothed, d-c voltages necessary for operation of the preamplifier and power amplifier, and also the 6SC7 SHORT LEADS TO CA fir RIDGE 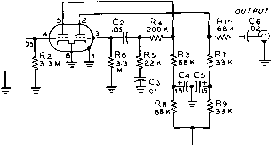 Figure 9 PREAMPLIFIER SUITABLE FOR USE WITH LOW LEVEL RELUCTANCE CARTRIDGE. HANDBOOK High Fidelity Amplifier 139 PHONOGRAPH PREAMPLIFIERI- J- AMPLIFIER LOUD SPEAKER POWER SUPPLY SPEAKER ENCLOSURE Figure 10 BLOCK DIAGRAM OF HIGH FIDELITY MUSIC SYSTEM. BASS BOOST AND ATTENUATION TREBLE BOOST AND ATTENUATION 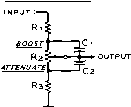 ATTENUATE OUTPUT EQUIVALENT CIRCUITS ATTENUATE EQUIVALENT CIRCUITS BOOST ATTENUATE 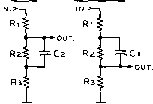 Figure 11 SIMPLE R-C CIRCUITS MAY BE USED FOR BASS AND TREBLE BOOST OR ATTENUATION. filament voltages (usually a-c) for the heaters of the various amplifier tubes- The loudspeaker is a device wrhich couples the electrical energy of the high fidelity system to the human ear and usually limits the overall fidelity of the complete system. Great advances in speaker design have been made in the past years, permitting the loudspeaker to 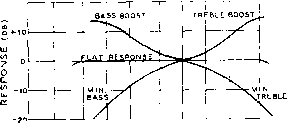 10 20 SO 100 200 500 1000 2000 5000 10000 FREQUENCY (CPS) Figure 12 FREQUENCY RESPONSE CURVES FOR THE BASS AND TREBLE BOOST AND ATTENUATION CIRCUITS OF FIGURE 11. hold its own in the race for true fidelity. Speaker efficiency runs from about 10% for cone units to nearly 40% for high frequency tweeters. The frequency response of any speaker is a function of the design and construction of the speaker enclosure or cabinet that mounts the reproducer. Tone Equalizer networks are em- Compensal-on ployed in high fidelity equipment to 1)-tailor the response curve of the system to obtain the correct overall frequency response, 2)-to compensate for inherent faults in the program material, 3) -or merely to satisfy the hearing preference of the listener. The usual compensation networks are combinations of RC and RL networks that provide a gradual attenuation over a given frequency range. The basic RC networks suitable for equlizer service are shown in figure 11. Shunt capacitance is employed for high frequency attenuation, and series capacitance is used for low frequency attenuation. A combination of these simple a-c voltage dividers may be used to provide almost any response, as shown in figure 12. It is common practice to place equalizers between two vacuum tubes in the low level stages of the preamplifier, as shown in figure 13. Bass and treble boost and attenuation of the order -12AX7 .04 -12AX7 .04 Figure 13 BASS AND TREBLE LEVEL CONTROLS, AS EMPLOYED IN THE HEATHKIT WA-P2 PREAMPLIFIER. INPUTS-H < p im4. 220 MMF. 100 > -.002 в 10 100 к 4- 3.3 к BASS CONTROL TREBLE CONTROL 2Nt90 2N190 1 к -12V 2N190 variable RELUCTANCE PICKUP ISK IK 1 VW-t--J-f- 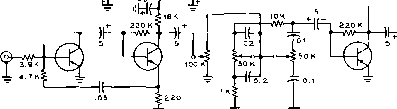 output BASS TREBLE Figure 14 TRANSISTORIZED HIGH-FIDELITY PREAMPLIFIER FOR USE WITH RELUCTANCE PHONOGRAPH CARTRIDGE. 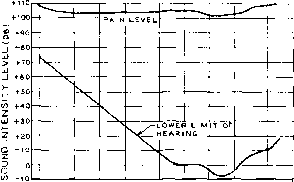 50 100 200 500 1000 2000 5000 10000 FREQUENCY (cps) Figure 15 THE FLETCHER-MUNSON CURVE ILLUSTRATING THE INTENSITY RESPONSE OF THE HUMAN EAR. of 15 db may be obtained from such a circuit. A simple transistorized preamplifier using this type of equalizing network is shown in figure 14. Rl 500 к 100 к - OUTPUT 62 TR2. .5R3 100 К 10 к : .03 Rl-R2-R3i THREE SECTION POTENTIOMETER, /PC TYPE, BUILT OF THE FOLLOWINCi R 1 -/ffC PQll- 7i3 R2- ?C MULTISECTION Ml3-li7 Rb-IRC MULTISECTION M13-IZd Figure 16 VARIABLE LOUDNESS CONTROL FOR USE IN LOW IMPEDANCE PLATE CIRCUITS. MAY BE PURCHASED AS IRC TYPE LC-1 LOUDNESS CONTROL. Loudness The minimum threshold of Compensoton hearing and the maximum threshold of pain vary greatly with the frequency of the sound as shown in the Fletcher-Munson curves of figure 15. To maintain a reasonable constant tonal balance as the intensity of the sound is changed it is necessary to employ extra bass and treble boost as the program level is decreased. A simple variable loudness control is shown in figure 16 which may be substituted for the ordinary volume control used in most audio equipment. The Power The power amplifier stage of Amplifier the music system must supply driving power for the loudspeaker. Commercially available loudspeakers are low impedance devices which present a ш </) z о Q-(Л Ш a. a. < и Q. 1л z < Q Ш CL 5
50 100 200 500 1000 2000 5000 10000 FREQUENCY (cp5) Figure 17 IMPEDANCE AND FREQUENCY RESPONSE OF 4-OHM 12-INCH SPEAKER PROPERLY MOUNTED IN MATCHING BAFFLE. 1 ... 10 11 12 13 14 15 16 ... 80 |
|||||||||||||||||||||||||||||||||||||||||||||||||||||||||||||||||||||||||||||||||||||||||||||||||||||||||||||||||||||||||||||||||||||||||||||||||||||||||||||||||||||||||||||||||||||||||||||
|
© 2026 AutoElektrix.ru
Частичное копирование материалов разрешено при условии активной ссылки |