 |
 |
 |
| Главная Журналы Популярное Audi - почему их так назвали? Как появилась марка Bmw? Откуда появился Lexus? Достижения и устремления Mercedes-Benz Первые модели Chevrolet Электромобиль Nissan Leaf |
Главная » Журналы » Metal oxide semiconductor 1 ... 48 49 50 51 52 53 54 ... 91 Under steady-state conditions, the operation of the fuU bridge is similar to that of the half bridge. When and q4 turn on, the voltage across the secondary winding is v-v. (20.72) Neglecting diode voltage drops and losses, the voltage across the output inductor is then given by (20.73) О In this interval, the inductor current 1ц increases linearly at a rate of din Уи v.-v (20.74) At the end of Qi and q4 on-time, 4i reaches a value that is given by V - V 1 0 (20.75) During the interval A, decreases linearly at a rate of (20.76) The next half-cycle repeats with q2 and q3 on and the circuit operates in a similar manner as in the first half-cycle. Again, as in the half-bridge, the output voltage can be found from the time integral of the inductor voltage over a time equal to t. Thus, we have n = 2 X - v,-vAdt + T/2+DT FIGURE 20.27 A simplified full-bridge regulator: (a) circuit, (b) associated waveforms. Solving (20.77) for V, we have -Vjt (20.77) (20.78) voltage is stepped down, rectified, and then filtered to produce a dc output voltage. The capacitor Q is used to balance the volt-second integrals of the two switching intervals and prevent the transformer from being driven into saturation. The output power Pg is given by Po = Pin (20.79) (20.80) where р(ду) has the same definition as in the half-bridge case. Comparing (20.80) with (20.69), we see that the output power of a fuU bridge is twice that of a half-bridge with same input voltage and current. The maximum coUector currents for Qp Q2, Q3, and Q4 are given by C(max) - p{avg) (20.81) If we compare (20.81) with (20.70), for the same output power, the maximum coUector current is only half that of the half-bridge. As mentioned, the maximum collector voltage for and Q2 at turn-off is given by C(max) = /(max) (20.82) The design of the fuU bridge is simUar to that of the half-bridge. The only difference is the use of four power switches instead of two in the fuU bridge. Therefore, additional drivers are required by adding two more secondary windings in the pulse transformer of the driving circuit. For high-power applications ranging from several hundred to a thousand kUowatts, the fuU-bridge regulator is an inevitable choice. It has the most efficient use of magnetic core and semiconductor switches. The fuU bridge is complex and therefore expensive to buUd, and is only justified for high-power applications, typically over 500 W. main reasons for their popularity. First, low-cost fixed-frequency PWM 1С controUers have been developed by various solid-state device manufacturers, and most of these 1С controUers have aU the features that are needed to buUd a PWM switching power supply using a minimum number of components. Second, because of their fixed-frequency nature, fixed-frequency controllers do not have the problem of unpredictable noise spectrum associated with variable frequency controUers. This makes EMI control much easier. A PWM fixed-frequency controUer consists of four main functional components: an adjustable clock for setting the switching frequency, an output voltage error amplifier for detecting deviation of the output from the nominal value, a sawtooth generator for providing a sawtooth signal that is synchronized to the clock, and a comparator that compares the output error signal with the sawtooth signal. The output of the comparator is the signal that drives the controUed switch. Figure 20.28 shows a simple PWM controUed forward regulator operating at fixed frequency. The duration of the on-time is determined by the time between the reset of the sawtooth generator and the intersection of the error voltage with the positive-going ramp signal. 20.5.5 Control Circuits and Pulse-Width Modulation In previous subsections, we presented several popular voltage regulators that may be used in a switching-mode power supply. This section discusses the control circuits that regulate the output voltage of a switching regulator by constantly adjusting the conduction period or duty cycle d of the power switch. Such adjustment is caUed pulse-width modulation (PWM). The duty cycle is defined as the fraction of the period during which the switch is on, i.e.. ton + (20.83) By adjusting either or t, or both, d can be modulated. Thus, PWM-controlled regulators can operate at variable frequency as weU as fixed frequency. Among aU types of PWM controUers, the fixed-frequency controller is by far the most popular choice. There are two The error vohage is given by v. = ( l+$Vi£F-$v2 (20.84) From (20.84), the smaU-signal term can be separated from the dc operating point by Av, = - -Av2 1 The dc operating point is given by (20.85) (20.86) Inspecting the waveform of the sawtooth and the error voltage shows that the duty cycle is related to the error voltage by (20.87) where Vp is the peak vohage of the sawtooth. Fience, the smaU-signal duty cycle is related to the smaU-signal error voltage by Ad = (20.88) The operation of the PWM fixed-frequency controUer can be explained as foUows. When the output is lower than the nominal dc value, a high error voltage is produced. This means that Av, is positive. Fience, Ad is positive. The duty cycle is increased to cause a subsequent increase in output voltage. Such is a typical voltage-mode control operation. The feedback dynamics (stabUity and transient response) is determined by the operational amphfier circuit that consists of and Z2. Some of the popular voltage-mode control ICs are SG1524/25/26/27, TL494/5, and MC34060/63. In addition to the voltage-mode control, a control scheme known as current-mode control makes use of the current information in a regulator to achieve output voltage regulation. In its simplest form, current-mode control consists of an inner loop that samples the inductance current value and turns the switches off as soon as the current reaches a certain value set by the outer voltage loop. In this way, the current-mode control achieves faster response than the voltage mode. In current-mode control, no sawtooth generator is needed. In fact, the inductance current waveform is itself a sawtooth. The voltage analog of the current may be provided by a smaU resistance, or by a current transformer. Also, in practice, the switch current is used since only the positive-going portion of the inductance current waveform is required. Figure 20.29 shows a current-mode controUed flyback regulator. In Fig. 20.29, the regulator operates at fixed frequency. Turn-on is synchronized with the clock pulse, and turn-off is determined by the instant at which the input current equals the error voltage. О FIGURE 20.29 A simplified current-mode controlled flyback regulator: (a) circuit, (b) the associated waveforms. Because of its inherent peak-current limiting capabUity, current-mode control can enhance rehabUity of power switches. The dynamic performance is improved because of the use of the additional current information. Moreover, current-mode control makes power factor correction possible. Some of the popular current-mode control ICs are UC3840/2, UC3825, MC34129, and MC34065. It should be noted that current-mode control is particularly effective for the flyback and boost-type regulators that have an inherent right-half-plane zero. Current-mode control effectively reduces the system to first order by forcing the inductor current to be related to the output vohage, thus achieving faster response. In the case of the buck-type regulator, current-mode control presents no significant advantage because the current information can be derived from the output voltage, and hence faster response can stiU be achieved with a proper feedback network. References 1. A. i. Pressman, Switching Power Supply Design, 2nd ed.. New York: McGraw-Hill, 1999. 2. M. Brown, Practical Switching Power Supply Design, 2nd ed.. New York: McGraw-Hill, 1999. 3. P. T. Krein, Elements of Power Electronics, 1st ed., Cambridge: Oxford University Press, 1998. 4. J. G. Kassakian, M. R. Schlecht, and G. C. Verghese, Principles of Power Electronics, 1st ed., Reading, MA: Addison-Wesley, 1991. 5. G. Chryssis, High-Frequency Switching Power Supplies, 1st ed.. New York: McGraw-Hill, 1984. 6. T. L. Floyd and D. Buchla, Fundamentals of Analog Circuits, 1* ed.. New Jersey: Prentice Hall, 1999. Electronic Ballasts J. Marcos Alonso, Ph.D. University of Oviedo DIEECS - Tecnologia Electronica Campus de Viesques s/n, Edificio de Electronica 33204 Gijon - Spain 21.1 Introduction...................................................................................... 507 21.1.1 Basic Notions 21.1.2 Discharge Lamps 21.1.3 Electromagnetic Ballasts 21.2 High-Frequency Supply of Discharge Lamps........................................... 513 21.2.1 General Block Diagram of Electronic Ballasts 21.2.2 Classification of Electronic Ballast Topologies 21.3 Discharge Lamp Modeling................................................................... 516 21.4 Resonant Inverters for Electronic Ballasts............................................... 519 21.4.1 Current Fed Resonant Inverters 21.4.2 Voltage Fed Resonant Inverters 21.4.3 Design Issues 21.5 FLigh Power Factor Electronic Ballasts.................................................... 527 21.5.1 Harmonic Limiting Standards 21.5.2 Passive Solutions 21.5.3 Active Solutions 21.6 Applications....................................................................................... 529 References.......................................................................................... 531 21.1 Introduction Electronic baUasts, also called sohd-state baUasts, are those power electronic converters used to supply discharge lamps. The modern age of electronic baUasts began with the introduction of power bipolar transistors with low storage time, aUowing supply of fluorescent lamps at frequencies of several kUohertz and increasing lamp luminous efficacy by operating at these high frequencies. Later, electronic baUasts become very popular with the development of low-cost power MOSFETs, whose unique features make them very attractive for implementing sohd-state baUasts. The main benefits of electronic baUasts are increased lamp and baUast overaU efficiency, increased lamp life, reduction of baUast size and weight, and improvement in lighting quality. This chapter gives a general overview of the more important topics related to this type of power converters 21.1.1 Basic Notions Discharge lamps generate electromagnetic radiation by means of an electric current passing through a gas or metal vapor. This radiation is discrete, as opposed to the continuous radiation emitted by an incandescent filament. Figure 21.1 shows the electromagnetic spectrum of an electric discharge, which consists of a number of separate spectral lines. As can be seen in Fig. 21.1, only the electromagnetic radiation emitted within the visible region (380-780 nm) of the radiant energy spectrum is useful for lighting. The total power in watts emitted by an electric discharge can be obtained by integrating the spectral energy distribution. FLowever, this is not a suitable parameter to measure the amount of light emitted by a discharge lamp. The human eye responds differently to the different types of electromagnetic waves within the visible range. As iUustrated in Fig. 21.2, there exist two response curves. First, the photopic curve, also caUed У(Я), is the characteristic used to represent human eye behavior under normal iUumination level conditions or daylight vision. Secondly, the scotopic curve V\X) is the response of the human eye for situations with low iUumination levels, also known as nocturnal vision. The reason for this different behavior is physiologic. The human eye consists of two types of photoreceptors: rods and cones. Rods are much more sensitive than cones at low lighting levels, but they are not sensitive to the different light colors. On the other hand, cones are responsible for normal color vision at higher lighting levels [5, 7]. Normally, only the photopic function is considered in hghting design and used to calibrate photometers. Because the human eye responds in different ways to the different wavelengths or colors, the output power of a lamp measured in watts is no longer applicable to represent the amount of hght generated. Thus, a unit is used that incorporates human eye response, which is called the lumen. The total hght output of a lamp is then measured in lumens and is known as lamp luminous flux. The lamp luminous flux is obtained by integrating the radiant power as foUows: 780 nm P{X)V{X)dX (21.1) 380 nm 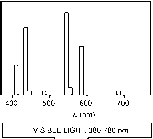 Perfectly Diffusing Coating
10-14 10-12 10-° 10- 10-6 10-4 10-2 1 (nm) FIGURE 21.1 Spectral energy distribution of an arc discharge and radiant energy spectrum. 0.8 0.6 0.4 0.2
380 480 580 680 A/(nm) FIGURE 21.2 Spectral luminous efficiency functions for standard photopic and scotopic observers. where represents the maximal spectral luminous efficacy, which is equal to 683 lumens/watt (at Я = 555 nm) for photopic vision and 1700lumens/watt (at Я = 507 nm) for scotopic vision. The standard photopic and scotopic functions were defined by the International Commission on lUumination (CIE) in 1924 and 1951, respectively [5]. The measurement of the lamp total luminous flux is very useful in determining whether the lamp is working properly or not. At the laboratory, the measurement of the lamp total luminous flux is performed by means of an integrating sphere and using the substitution method. The integrating sphere, also known as an Ulbricht photometer, is internally coated with a perfectly diffusing material. Thus, the sphere performs the integral in (21.1) and the iUuminance on the internal surface is proportional to the total luminous flux. A photometer with a V(l) filter is placed so that the internal iUuminance can be measured, and a baffle is placed to avoid direct iUumination of the photometer probe by the lamp. The measurement is made in two steps, one with the lamp under 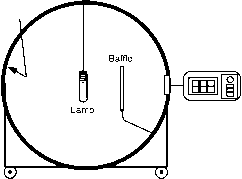 Pliotometer witli V(;i) probe FIGURE 21.3 Integrating sphere used for measurement of the lamp total luminous flux. test in place and the other with a standard lamp of known total luminous flux. From the two measurements, the total luminous flux of the lamp under test is deduced by a linear relationship. Figure 21.3 iUustrates an integrating sphere photometer. An important parameter related to the supply of discharge lamps is the luminous efficacy. Luminous efficacy is defined as the rate of the lamps total luminous flux to the total electric power consumed by the lamp, usually expressed in lumens per watt. The luminous efficacy of a discharge lamp can be increased by proper design of the electronic baUast, which also resuhs in energy savings. 21.1.2 Discharge Lamps Basically, discharge lamps consist of a discharge tube inside which the electric energy is transformed into electromagnetic radiation. The discharge tube is made of a transparent or translucent material with a sealed electrode placed in each end, as shown in Fig. 21.4. The discharge tube is fiUed with an inert gas and a metal vapor. The electrodes generate free electrons, which are accelerated by the electrical field existing in the discharge. These accelerated electrons coUide with the gas atoms, having both elastic and inelastic coUisions depending on the electron kinetic energy. The basic processes inside the discharge tube, iUustrated in Fig. 21.4, are the following: 1. Heat generation. When the kinetic energy of the electron is low, an elastic coUision takes place and only a smaU part of the electron energy is transferred to the gas atom. The result of this type of coUision is an increase in the gas temperature. In this case, the electrical energy is consumed to produce heat dissipation. However, this is also an important process because the discharge has to set in its optimum operating temperature. 2. Gas atom excitation. Some electrons can have a high kinetic energy so that the energy transferred in the coUision is used to send an electron of the gas atom to 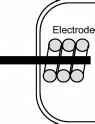   Heat generation Energy radiation 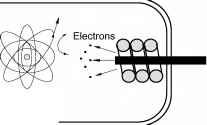 Ionization FIGURE 21.4 Basic processes inside the discharge volume. a higher orbit. This situation is unstable and the electron trends to recover its original level, then emitting the absorbed energy in the form of electromagnetic radiation. This radiation is used to directly generate visible light. In other cases, ultraviolet radiation is first generated and then transformed into visible radiation by means of a phosphor coating on the inside wall of the discharge tube. 3. Gas atom ionization. In some cases electrons have gained such a high kinetic energy that during a coUi-sion with a gas atom an electron belonging to the gas atom is freed, resulting in a positively charged ion and a free electron. This freed electron can play the same roles as those generated by the electrodes. This process is especially important during both discharge ignition and normal operation, because ionized atoms and electrons are necessary to maintain the electric current through the lamp. The number of free electrons in the discharge can increase rapidly because of continuing ionization, producing an unlimited current and finally a short-circuit. This is illustrated in Fig. 21.5, which shows how the voltage-current characteristic of a gas discharge exhibits a negative differential resistance. Therefore, to limit the discharge current the use of an auxiliary supply circuit is mandatory. This circuit is called a ballast.
Il l2 I FIGURE 21.5 Voltage-current characteristic of an electric discharge. Focusing on discharge lamps, the complete stabilization process consists of two main phases: 1. Breakdown phase. Most gases are very good insulators, and an electric discharge is only possible if a sufficient concentration of charged particles is present. Normally, a high voltage is used to provide electricity carriers and to initiate the discharge. The minimum voltage applied to initiate the discharge is called the starting voltage. The starting voltage mainly depends on the type of gas, gas pressure, and distance between electrodes. Figure 21.6a represents the starting voltage as a function of the product gas pressure multiphed by electrode distance, for different gases. These functions are known as Paschen curves. Usually, auxiliary inert gases are used to decrease the starting voltage. There exist some especially inert gas mixtures presenting a very low starting voltage, which are caUed Penning mixtures. These Penning mixtures are often used as initial starting gases. Figure 21.6a shows a typical Penning mixture consisting of neon with 0.1% argon. 2. Warm-up phase. Once the lamp is ignited, the coUi-sions between free electrons and atoms generate heat and discharge temperature increases until normal operating conditions are reached. During this phase the heat is used to evaporate the metal atoms existing in the discharge tube, and the emitted electromagnetic radiation assumes the character of a metal vapor discharge instead of that of an inert gas discharge. From the electrical point of view, the discharge warm-up phase shows initially low discharge voltage and high discharge current. As long as more and more metal atoms are evaporated, the discharge voltage increases and the discharge current decreases. Finally, an equilibrium is reached at steady-state operation with the normal values of voltage and current. The time constant of the warm-up phase strongly depends on the lamp type. It varies from seconds for fluorescent lamps to minutes for high-intensity discharge lamps. Figure 21.6b iUustrates some discharge waveforms during the warm-up phase. 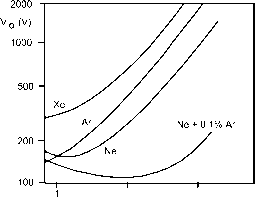 10 100 p-le(Pa-m) 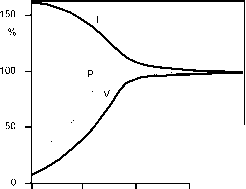 V- Voltage I - Current Ф P- Power Ф- Total Luminous Flux 1.0 2.0 3.0 Time (minutes) (a) (b) FIGURE 21.6 (a) Paschen curves for different inert gases; and (b) stabilization curve of a discharge lamp. The basic elements used in lamps to generate radiation in the visible part of the spectrum are sodium and mercury. The former generates radiation directly within the visible part of the spectrum; the latter generates radiation mainly in the ultraviolet region, but this radiation can be easily transformed into visible radiation by means of a phosphor coating on the internal waU of the discharge volume. Besides the element used, a very important parameter related to the efficiency and richness of the emitted radiation is the discharge pressure. For sodium and mercury elements, there exist two pressure values around which the luminous efficacy of the discharge is higher. The first is obtained at quite low pressures, about 1 Pa, and the second at higher pressures, around 10 Pa (1 atm). This is why there exist two main types of discharge lamps: 1. Low-pressure discharge lamps. This type of lamp operates at pressures around 1 Pa and features low current density inside the discharge and low power per unit of discharge length. Therefore, these lamps normally present a quite large discharge volume with a low power rating. The most representative examples are low-pressure mercury lamps, also known as fluorescent lamps, and low-pressure sodium lamps. 2. High-pressure discharge lamps. The operating pressure in this type of lamp is raised to 10 Pa and higher in order to achieve a considerable increase in the luminous efficacy of the discharge. These lamps present a high current density in the discharge and a high power per discharge length ratio, thus showing much smaUer discharge volumes. Examples are high-pressure sodium lamps, high-pressure mercury lamps, and metal hahde lamps. Finally, to characterize the light produced by a discharge lamp it is necessary to understand two important concepts: the correlated color temperature (CCT) and the color rendering index (CRI). The correlated color temperature is defined as the temperature of the blackbody radiator whose perceived color most closely resembles that of the discharge lamp. The color of an incandescent body changes as its temperature rises from deep red to orange, yeUow, and finally white. Thus, a cool white fluorescent lamp has a CCT around 3500 К and is perceived as a white source of light, whereas a high-pressure sodium lamp presents a CCT of about 2000 К and appears yeUow. The color rendering index of a light source is the effect that the source has on the color appearance of objects when compared to their appearance under a reference source of equal CCT. The measurement gives a value lower than 100, and a higher CRI means better color rendition. For example, daylight and incandescent lamps have CRIs equal to 100. To conclude this introduction to discharge lamps, some comments regarding the most important types of discharge lamps wiU be given. Table 21.1 provides some additional data for the different discharge lamps for comparison. 1. Fluorescent lamps. These lamps belong to the category of low-pressure mercury-vapor discharge lamps. The discharge generates two main lines at 185 and 253.7 nm and other weak lines in the visible range of the spectrum. A fluorescent powder on the inside waU of the discharge tube converts the ultraviolet radiation into visible radiation, resulting in a broadband spectral distribution and good color rendition. In these lamps the optimum mercury vapor pressure (which gives the maximum luminous efficacy) is 0.8 Pa. For the tube diameters normally used, this pressure is reached at a waU temperature of about 40 °C, not much higher than typical ambient temperature. The heat generated inside the discharge is sufficient to attain the required operating temperature without the use of an outer TABLE 21Л Comparison of different discharge lamps
bulb. FLowever, this structure causes a great variation of the lamp lumen output with the temperature, which is one important drawback of fluorescent lamps. One solution to this problem is the addition of amalgams to stabilize the light output. This is especially used in compact fluorescent lamps. 2. Low-pressure sodium lamps. These lamps are a most efficient source of light. The reason is the almost monochromatic radiation that they generate, with two main lines at 589 and 589.6 nm, very close to the maximum human eye sensitivity. Therefore, the color rendition of these lamps is very poor; however, contrasts are seen more clearly under this light. This is why these lamps are used in situations where the recognition of objects and contours is essential for safety, such as motorway bridges, tunnels, and intersections. The optimum pressure for the low-pressure sodium discharge is about 0.4 Pa, attained in normal discharge tubes at a temperature of 260 °C. An outer bulb is normally used to reach and maintain this temperature. 3. High-pressure mercury vapor lamps. The increase in the pressure of the mercury vapor produces a radiation richer in spectral lines, some of them in the visible part of the spectrum (405, 436, 546, and 577/579 nm). This leads to an increase in the luminous efficacy, reaching values of 40-60 ImW at pressures of 10-10 Pa (1-100 atm). These lamps operate with unsaturated mercury vapor, which means that aU the mercury in the discharge volume has evaporated and the number of mercury atoms per unit volume remains constant. Thus, the operation of this type of lamps is more independent of the temperature than that of most other discharge lamps. One drawback of these lamps is the lack of spectral lines in the long wavelengths (reds) of the spectrum, thus giving a low color rendering index. An increase of the color rendition can be obtained by adding metal-halide compounds into the discharge volume, in order to generate radiation aU over the visible spectrum. These lamps are known as metal halide lamps [3]. 4. High-pressure sodium lamps. This is a very popular source of light because of its high luminous efficacy and long life. The increase in the sodium vapor pressure produces a very wide spectrum, with good color rendition compared with the low-pressure sodium lamps. This also leads to a lower luminous efficacy that is stiU higher than those of other high-intensity discharge lamps. Some of these lamps also incorporate mercury in the form of sodium amalgam to increase the field strength of the discharge, thus decreasing the discharge current. A lower lamp current and a higher lamp voltage aUow reduced size and cost of the ballast. FLowever, the addition of sodium amalgam greatly reduces the life of the lamp. 21.1.3 Electromagnetic Ballasts Electromagnetic baUasts are commonly used to stabUize the lamp at the required operating point by limiting the discharge current. The operating point of the lamp is given by the intersection of both lamp and ballast characteristics, as shown in Fig. 21.7. The ballast hne is the characteristic that shows the variation of the lamp power versus lamp voltage for a constant line voltage; it can be measured during the warm-up phase of the lamp. The lamp line is the characteristic that gives the variation of the lamp power as a function of the lamp voltage for different line voltages and can be measured by varying the line voltage. Some lamps, such as high-pressure sodium, exhibit a great variation of lamp voltage with changes in the lamp wattage. Because of this behavior, trapezoids have been established that define maximum and minimum permissible lamp wattage versus lamp voltage for purposes of baUast design, as shown in Fig. 21.7. Figure 21.8 shows basic electromagnetic baUast used to supply low- and high-pressure lamps at hne frequencies (50-60FLz). Figure 21.8a illustrates the typical circuit used to supply fluorescent lamps with preheating electrodes, which basically uses a series inductor to limit the current through the discharge. Initially the glow switch is closed and the short-circuit current flows through the circuit, heating the LAMP WATTAGE Maximum lamp wattage 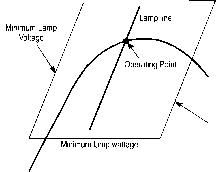 Ballast line Maximum Lamp Voltage LAMP VOLTAGE FIGURE 21.7 Lamp and ballast characteristics. electrodes. A few fractions of a second later, the glow switch is opened and the energy stored in the baUast inductor causes a voltage spike between the lamp electrodes (about 800 V), which finally produces the discharge breakdown. Once the lamp is ignited, its voltage is lower than the line voltage, and the glow switch remains open during normal lamp operation. Typical glow switches are based on two bimetal strips inside a small tube fiUed with an inert gas. An external capacitor of about lOnF is used to enhance the glow switch operation and also to reduce radio interference during lamp startup. Finally, in this type of inductive baUasts a capacitor placed across the line input is mandatory to achieve a reasonable value of the input power factor. Starting voltages of high-pressure discharge lamps are normally higher than those of low-pressure discharge lamps and can go from 2500 V for a lamp at room temperature to 30-40 kV to reignite a hot lamp. Thus, the simple ignition system based on the glow switch is no longer applicable for these lamps. Figures 21.8b and 21.8c show two typical arrangements for supplying high-intensity discharge lamps. A series inductor is also used to limit the lamp current at Ballast Ballast Line Glow Switch I Line Starter Ballast Starting Transformer Line У I- Starter Line Air Gapped Core Ж FIGURE 21.8 Typical electromagnetic ballast used to supply discharge lamps at low frequency. Steady-State operation, but autotransformers are used to attain higher voltage spikes for lamp ignition. For higher line voltages and short distances between starter and lamp, the inductor ballast can be used as ignition transformer as shown in Fig. 21.8b. In other cases, a separate igniting transformer is needed to provide higher voltage spikes and to avoid the effect of parasitic capacitance of connection cables (Fig. 21.8c). The inductive baUast provides low lamp power regulation against line voltage variation, and therefore it is only recommended in those instaUations with low voltage fluctuations. When good lamp power regulation is necessary, the circuit shown in Fig. 21.8d is normally used. This circuit is commonly termed a constant wattage autotransformer (CWA) and incorporates a capacitor in series with the lamp to hmit the discharge current. Compared with the normal inductive baUast, the CWA also exhibits a higher input power factor, lower line extinguishing voltage, and lower line starting currents. The main advantage of electromagnetic baUasts is their simphcity, which in turn provides low cost and high reliabUity. However, since they operate at line frequencies, typically 50-60 Hz, they also feature high size and weight. Other important drawbacks of electromagnetic baUasts are the foUowing: Low efficiency, especially for those baUasts featuring good lamp power regulation against line voltage variation. Low reliabUity for ignition and reignition. If the voltage spike is not located weU within the hne period, the ignition of the lamp can faU. Difficulty in controUing the lamp luminous flux (dimming). Lamp operating point changes due to the lamp aging process that reduce lamp life. Low input power factor and high harmonic distortion. Large capacitors are needed across the line input to increase power factor. Overcurrent risk due to ballast saturation caused by the rectifying effect of some discharge lamps, especially at the end of their life. Flickering and stroboscopic effect due to low-frequency supply. The energy radiated by the lamp is a function of the instantaneous input power. Therefore, when the lamp is supplied from an ac line, an instantaneous variation of the light output occurs, which is caUed flicker. For a line frequency of 60 Hz the resulting hght frequency is 120 Hz. This variation is too fast for the human eye, but when rapidly moving objects are viewed under these lamps, the objects seem to move slowly or even are halted. This is called the stroboscopic effect and can be very dangerous in industrial environments. A flicker index is defined with values from 0 to 1.0 [1]. The higher the flicker index, the greater the possibility of a noticeable stroboscopic effect. 1 ... 48 49 50 51 52 53 54 ... 91 |
|
© 2026 AutoElektrix.ru
Частичное копирование материалов разрешено при условии активной ссылки |